Benefits Benchmarking by Industry: Are You Competitive in Your Sector?
By Todd Taylor
|
Last updated: July 26, 2026
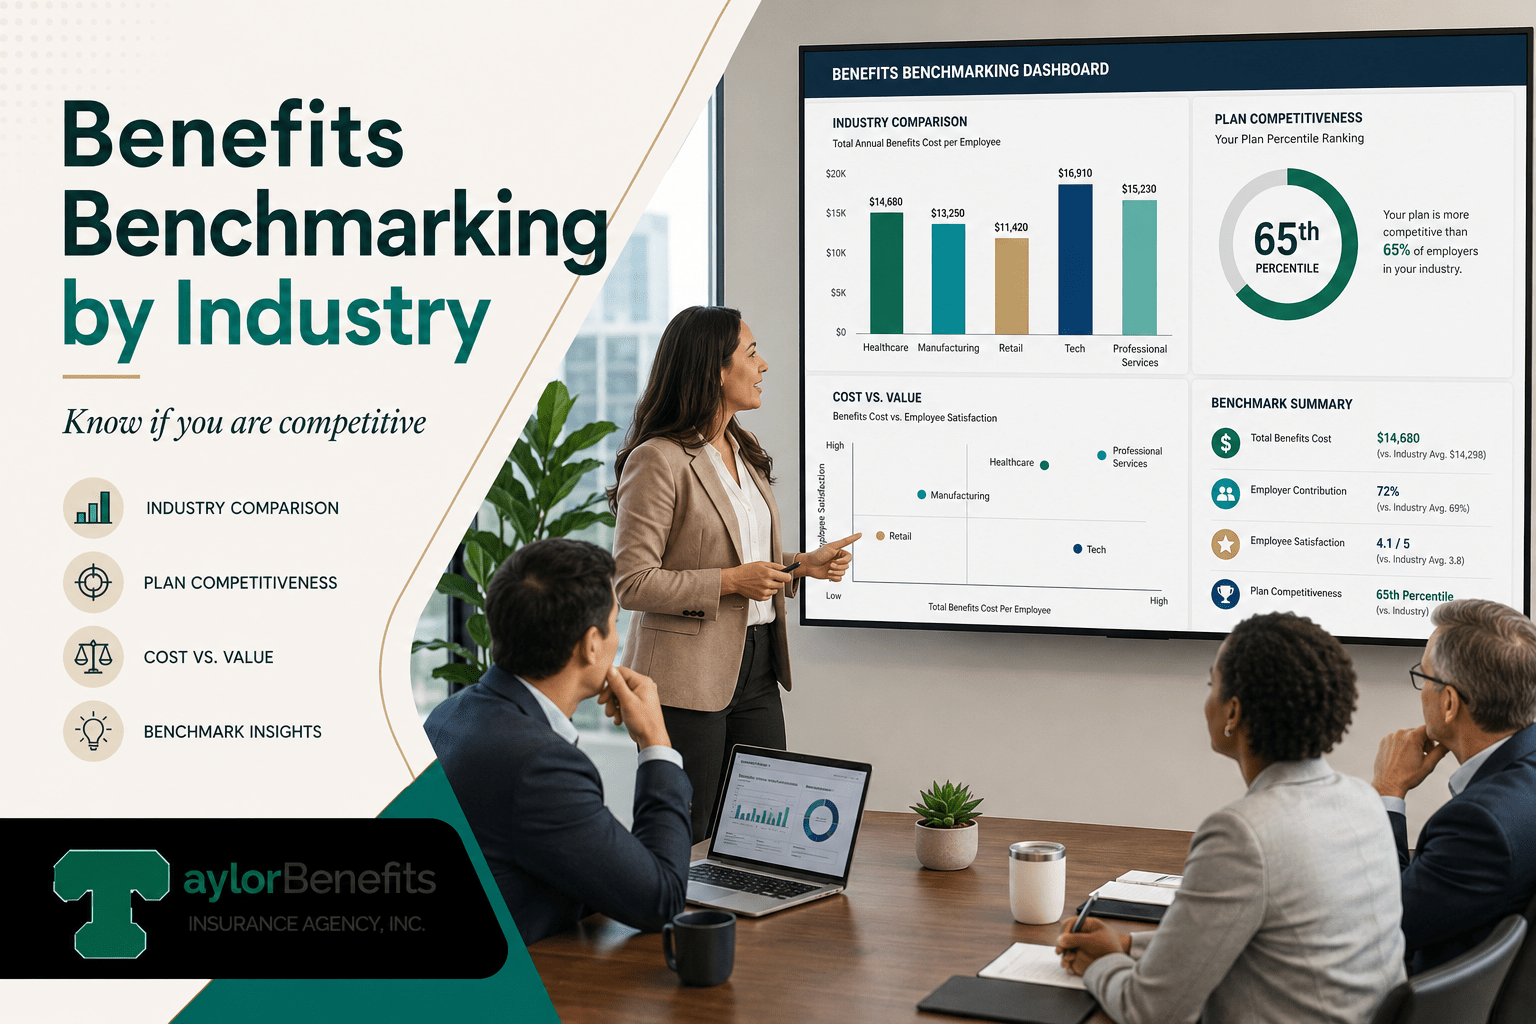
The generic benchmarking advice, ‘compare to your peers, use SHRM data, survey your employees’, is widely available and consistently insufficient for employers trying to answer a specific question: are our benefits competitive for the industry we’re actually recruiting in?
That question requires industry-specific data, not general market averages. A healthcare employer competing for clinical talent faces different benchmarks than a software company recruiting engineers, a manufacturing firm hiring skilled trades, or a nonprofit managing tight budgets while competing with for-profit employers. The benefits that matter most, the contribution structures that are standard, and the plan types that are expected all vary substantially by industry.
This article provides industry-specific benchmarking standards across the sectors where employers most often need concrete reference points. It builds on our general benchmarking guide with the actual numbers and expectations sector by sector.
How to Use Industry Benchmarking Data
Before the sector-specific benchmarks, three framing points that affect how to apply this data:
Company size affects benchmark applicability- The benchmarks below reflect typical practices across mid-market employers — generally 50 to 500 employees. Smaller employers typically have lower contribution rates; larger employers typically have more generous packages.
Geography matters within industry- Technology employers in San Francisco face different expectations than those in Kansas City. The benchmarks below represent typical national ranges; high-cost markets typically run toward the upper end.
Benchmarks define the floor, not the ceiling- Matching benchmark is the minimum for competitiveness. Employers who want to differentiate on benefits need to position above median.
Technology and Software
The technology sector sets some of the highest benefits benchmarks in the private employer market, driven by intense competition for engineering, product, and technical talent.
Health insurance: Employer contribution rates for employee-only coverage typically run 80 to 100 percent of premium in the technology sector — many tech employers pay the full premium for employee coverage. Family coverage contributions are typically 60 to 75 percent of premium. HDHP plans with employer HSA contributions of $500 to $1,500 are the dominant structure, though some larger tech employers offer both HDHP and PPO options.
Retirement: 401(k) matching of 4 to 6 percent of salary is standard. Faster vesting schedules — including immediate vesting — are increasingly common in tech as a differentiator.
Mental health: The technology sector has moved faster than most on mental health benefits. Employer-sponsored therapy access, EAP programs with substantial session counts (10+), and telehealth mental health coverage are now expected.
Supplemental and voluntary: Fertility benefits (including IVF), gender-affirming care, student loan repayment assistance, and professional development stipends are common differentiators in competitive tech markets.
PTO: Flexible or unlimited PTO policies are common, though actual average usage typically runs 15 to 20 days.
Where small and mid-size tech companies typically fall short: Contribution rates below 80 percent for employee-only coverage, HDHP-only structures without HSA employer seeding, and mental health benefits limited to standard EAP sessions.
Healthcare and Clinical Settings
Healthcare employers face a specific paradox: they are benefit-intensive employers competing in a labor market where clinical professionals have detailed knowledge of healthcare coverage quality.
Health insurance: Employer contribution rates for employee-only coverage typically run 70 to 85 percent. Healthcare employers commonly offer multiple plan options including lower-deductible plans — recognizing that healthcare workers often understand the value of lower cost-sharing. Strong provider network quality and care access matter particularly to clinical staff.
Retirement: Nonprofit healthcare systems (those operating under 501(c)(3) status) often offer 403(b) plans with matching. For-profit healthcare employers offer 401(k) plans. Matching of 3 to 5 percent of salary is typical. Some healthcare systems also offer pension-like defined benefit components for long-tenured employees.
Disability coverage: Short-term and long-term disability coverage with meaningful income replacement rates (typically 60 to 70 percent of salary) is expected in healthcare employment. Clinical staff have above-average disability risk and evaluate this coverage carefully.
Supplemental benefits: Clinical education reimbursement, professional license fee reimbursement, scrub and uniform allowances, shift differential pay, and on-call premium structures are common industry-specific components that affect total compensation perception.
Nurse and clinical staff-specific: The nursing shortage has driven significant benefits enhancement in healthcare. Sign-on bonuses, loan repayment assistance, flexible scheduling, and student loan repayment have become more prevalent as retention tools.
Where healthcare employers typically fall short: Contribution rates below 70 percent, HDHP-only structures that force clinical workers to apply for care through their own plan, and weak mental health benefits in a workforce with high burnout and mental health utilization.
Manufacturing and Industrial
Manufacturing employers typically serve a workforce with different priorities than professional services — with greater emphasis on income protection, physical health coverage quality, and financial stability over lifestyle benefits.
Health insurance: Employer contribution rates for employee-only coverage typically run 75 to 90 percent in manufacturing, with many employers offering fully paid employee coverage. Lower-deductible plan options are important — hourly manufacturing workers often have limited cash reserves to absorb high deductibles. Strong prescription coverage is important for workforces with above-average rates of chronic conditions.
Retirement: 401(k) with 3 to 5 percent matching is standard. Some larger manufacturing employers maintain traditional pension structures for legacy workforce. Profit-sharing contributions above standard matching are common at well-performing manufacturers.
Workers’ compensation and disability: Strong disability coverage — particularly short-term disability for occupational illness and injury — is expected and closely evaluated in manufacturing environments. Workers’ compensation experience affects culture and trust; employers known for good claims support have better retention.
Life insurance: Basic life insurance (1 to 2x annual salary) provided by the employer is standard. Voluntary supplemental life at group rates is highly utilized in manufacturing workforces.
Wellness programs targeting MSK and safety: Manufacturing employers with structured musculoskeletal health programs, ergonomics programs, and safety-focused wellness see meaningful workers’ compensation and disability cost reductions in addition to employee wellbeing benefits.
Where manufacturing employers typically fall short: HDHP-only structures inappropriate for the workforce’s financial profile, weak pharmacy benefits particularly for specialty and chronic disease medications, and mental health benefits that don’t address substance use disorder coverage adequately.
Health insurance: Employer contribution rates for employee-only coverage are typically lower than other sectors — 50 to 70 percent is common. Part-time and variable-hour eligibility rules are carefully managed around ACA thresholds. Many large retail and hospitality employers offer tiered coverage — different contribution levels for full-time versus qualifying part-time workers.
Telehealth: Telehealth with low or zero cost-sharing is particularly valued in retail and hospitality workforces where appointment scheduling during business hours is difficult. Leading employers in this sector embed telehealth as a core plan feature rather than an add-on.
Earned wage access: Earned wage access (on-demand pay) has become one of the most impactful benefits additions in retail and hospitality, addressing cash-flow pressures that affect lower-wage workforces directly. Employers in these sectors offering EWA report meaningful retention improvements.
Voluntary benefits: Critical illness, accident insurance, and hospital indemnity coverage are highly utilized in retail and hospitality workforces — providing financial protection against medical costs that HDHP plan structures would otherwise leave as out-of-pocket exposure.
Restaurant and food service specifics: Meal benefits, shift meal policies, and in some markets housing assistance have become relevant differentiators as labor markets in urban hospitality have tightened.
Where retail and hospitality employers typically fall short: Inadequate employer contribution rates that price employees out of coverage despite formal eligibility, benefits communication that doesn’t reach hourly workers effectively, and absence of earned wage access or emergency savings programs.
Professional Services (Legal, Accounting, Consulting)
Professional services firms compete for talent against both industry peers and the broader knowledge work market, creating high expectations across most benefit categories.
Health insurance: Employer contribution rates of 80 to 100 percent for employee-only coverage are standard. Strong PPO networks with broad specialty access matter to professional services employees who have established provider relationships. HDHP options with employer HSA seeding are common as a second plan option.
Retirement: 401(k) matching of 4 to 6 percent with profit-sharing contributions in good years is typical. Some firms offer retirement plan matching above salary base — bonus-inclusive matching is a meaningful differentiator in professional services.
Student loan repayment: Professional services firms hire heavily from graduate and professional degree programs with substantial debt loads. Student loan repayment assistance programs are among the highest-perceived-value benefits in this sector.
Parental leave: Professional services firms have moved substantially on parental leave policies. Eight to 16 weeks of paid maternity leave and 4 to 8 weeks of paid paternity or secondary caregiver leave are now common at competitive firms. Below-market parental leave is a material recruitment disadvantage in professional services.
Where professional services firms typically fall short: Inconsistent application of parental leave across genders (generous maternity, minimal paternity), inadequate mental health benefits for high-burnout workforces, and retirement matching that excludes bonus income.
Nonprofit Organizations
Nonprofit employers compete with for-profit employers for many of the same skills while operating under significant budget constraints.
Health insurance: Contribution rates of 75 to 85 percent for employee-only coverage are typical, often providing rich medical coverage as compensation for below-market salaries.
Retirement: 403(b) plans with employer matching of 3 to 5 percent are standard. Some nonprofits offer non-elective employer contributions as a compensation supplement.
Public Service Loan Forgiveness: PSLF eligibility for employees at qualifying 501(c)(3) organizations is one of the most significant benefits nonprofits can offer — yet one of the most poorly communicated. Employees with federal student loans working at qualifying nonprofits may be eligible for loan forgiveness after 10 years of qualifying payments. Actively communicating this benefit is one of the highest-value, zero-cost additions to a nonprofit benefits package.
Flexible work and mission alignment: Nonprofits often compete on work flexibility, remote access, and mission alignment as non-financial benefits, which partially offset compensation gaps.
Health insurance: Contribution rates of 75 to 90 percent are typical. Union construction workers typically receive benefits through multi-employer Taft-Hartley trust funds. Non-union contractors typically offer employer-sponsored plans reflecting the competitive labor market.
Disability and accident coverage: Income protection coverage — short-term and long-term disability plus accident and hospital indemnity — is the highest-priority benefit category after medical for construction workforces.
Retirement: Many union trades have defined benefit pension structures through multi-employer trust funds. Non-union contractors compete with 401(k) matching of 3 to 5 percent, often combined with profit-sharing.
Safety and wellness programs: Employers going beyond OSHA compliance with structured injury prevention and return-to-work programs see measurable workers’ compensation cost reduction alongside employee wellbeing improvements.
Using This Data in Your Benchmarking Process
The benchmarks above are starting points. For a rigorous industry benchmarking process, the recommended approach is:
Step 1: Identify your industry category and the specific talent markets you recruit from. A multi-industry employer may need benchmarks from multiple sectors.
Step 3: Identify gaps — areas where you are materially below benchmark — and assess the recruitment and retention cost of those gaps.
Step 4: Prioritize improvements. Not every gap warrants immediate investment. Gaps in foundational categories (health insurance contribution rates, retirement matching) typically have the highest retention impact and should be addressed first.
Step 5: Review your total compensation communication. Employers who benchmark well but communicate poorly still lose talent to competitors. Ensure your competitive benefits are visible to employees and candidates.
Bottom Line
Industry benchmarking is more useful than general market benchmarking — and more demanding. The specific numbers that define competitiveness vary enough across sectors that general guidance frequently misleads. Technology employers applying manufacturing benchmarks will underinvest; manufacturing employers applying technology benchmarks may over-invest in the wrong categories.
The benchmarks in this article provide a working reference for each sector. They should be supplemented with current market data from SHRM, Kaiser Family Foundation, and carrier benchmarking reports, updated annually, and validated against the specific competitive dynamics of the labor markets you recruit from.
Taylor Benefits Insurance Agency provides industry-specific benchmarking analysis and gap assessments as part of our standard renewal and plan design consultation process. If you’d like a formal benchmark comparison for your specific sector and workforce, contact our team.
Frequently Asked Questions
Benchmarking before expansion provides valuable information about local and industry expectations. Understanding competitive benefits helps employers create attractive compensation packages for new hires while supporting budget planning. This preparation can improve hiring success and establish a stronger employer reputation in the new market.
Written by Todd Taylor
Todd Taylor oversees most of the marketing and client administration for the agency with help of an incredible team. Todd is a seasoned benefits insurance broker with over 35 years of industry experience. As the Founder and CEO of Taylor Benefits Insurance Agency, Inc., he provides strategic consultations and high-quality support to ensure his clients’ competitive position in the market.
We just started working with Taylor Benefits and could not be happier. Todd gave us quite the education as well as some time saving tools to help us manage our HR and save money too. We are looking forward to a long relationship!”
-Carol,Accounting Manager, recruitment marketing company, Campbell, CA

 Technology and Software